This is a viewer only at the moment see the article on how this works.
To update the preview hit Ctrl-Alt-R (or ⌘-Alt-R on Mac) or Enter to refresh. The Save icon lets you save the markdown file to disk
This is a preview from the server running through my markdig pipeline
Monitoring is an essential part of maintaining the health and performance of your applications. I already have this site monitoring user visits using Umami and exceptions and errors using Seq but now I wanted to add performance monitoring to the mix. In this guide, we will explore how to set up monitoring for your ASP.NET Core applications using Grafana and Prometheus.
You can of course use the Grafana Cloud service, but for this guide, we will focus on setting up everything locally so you can have full control over your monitoring stack.
The goal is to get a dashboard something like this:
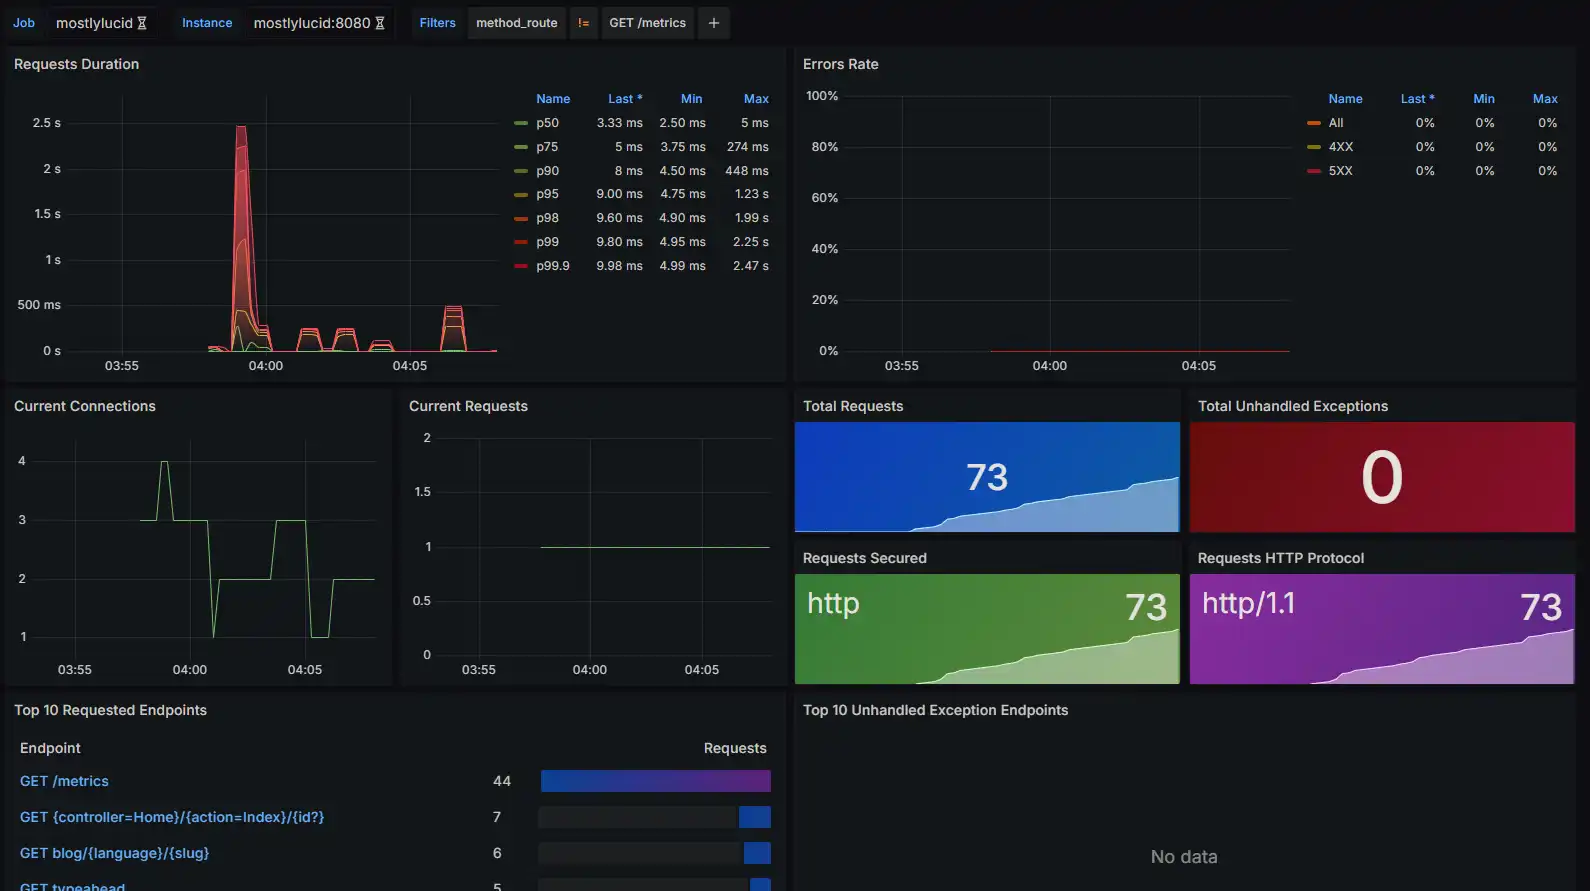
As usual with this site I wanted to add the Grafana and Prometheus elements to my docker compose file, this allows me to spin everything up and down in a single command and keep it all encapsulated.
Here you can see I set up prometheus and grafana services. These use my common app_network and have docker volumes to persist data.
  prometheus:
    image: prom/prometheus:latest
    container_name: prometheus
    volumes:
      - prometheus-data:/prometheus
      - ./prometheus.yml:/etc/prometheus/prometheus.yml
    command:
      - '--config.file=/etc/prometheus/prometheus.yml'
    labels:
      - "com.centurylinklabs.watchtower.enable=true"
    networks:
      - app_network

  grafana:
    image: grafana/grafana:latest
    container_name: grafana
    labels:
      - "com.centurylinklabs.watchtower.enable=true"
    volumes:
      - grafana-data:/var/lib/grafana
    networks:
      - app_network
    environment:
      - GF_SECURITY_ADMIN_USER=admin
      - GF_SECURITY_ADMIN_PASSWORD=testpassword1234
- volumes:
  grafana-data:
  prometheus-data:
You'll see I set up a default password (be sure and change this on first run!). I also enabled these to auto-update using Watchtower.
You'll note I don't map any ports here, I'll use Caddy to provide access to the Grafana service and Prometheus is only accessible from within the Docker network.
If you want to you can add
# Prometheus
    ports:
      - "9090:9090"
# Grafana
    ports:
      - "3000:3000"
Which can be handy if you're running locally. Note in Windows you can run your app in your IDE and use `'host.docker.internal:7240' (whatever port) to access your app from within the container. You'd also specify a 'bridge' network in your docker-compose file like so.
services:
  prometheus:
    image: prom/prometheus:latest
    container_name: prometheus
    volumes:
      - ./prometheus.yml:/etc/prometheus/prometheus.yml
    command:
      - '--config.file=/etc/prometheus/prometheus.yml'
    ports:
      - "9090:9090"
    networks:
      - monitoring

  grafana:
    image: grafana/grafana:latest
    container_name: grafana
    ports:
      - "3000:3000"
    networks:
      - monitoring
    environment:
      - GF_SECURITY_ADMIN_USER=admin
      - GF_SECURITY_ADMIN_PASSWORD=admin

networks:
  monitoring:
    driver: bridge
Then we add a new prometheus.yml file to configure Prometheus to scrape metrics from our ASP.NET Core application. Here’s a basic example of what that file might look like:
global:
  scrape_interval: 15s

scrape_configs:
  - job_name: 'mostlylucid'
    metrics_path: /metrics
    scheme: http
    static_configs:
      - targets: ['mostlylucid:8080']
Here you see I use the internal name mostlulucid which is the name of my docker service and it's default port of 8080.
I'll cover how you enable this in ASP.NET Core shortly.
I followed the instructions found here to set this up.
You first need to add the OpenTelemetry.Exporter.Prometheus.AspNetCore NuGet package to your ASP.NET Core project. You can do this by running the following command in your project directory:
dotnet add package OpenTelemetry.Exporter.Prometheus.AspNetCore
Next, you need to configure your application to expose metrics. In your Program.cs file, you can add the following code:
   services.AddOpenTelemetry()
        .WithMetrics(builder =>
        {
            builder.AddPrometheusExporter();
            builder.AddMeter("Microsoft.AspNetCore.Hosting", "Microsoft.AspNetCore.Server.Kestrel");
        });

    app.MapPrometheusScrapingEndpoint();
This provides the endpoint and data for Prometheus to scrape and sets up two 'Meters' which provide performance data for ASP.NET Core and Kestrel.
I spent some time messing with. This is a new feature in .NET 8 and is still a little flaky it seems. The config above gives the basic features you need for the ASP.NET dashboard but there's more information you can pass to Prometheus.
First the latest Beta of OpenTelemetry.Exporter.Prometheus.AspNetCore seems to be more stable than the beta 1 version (at the time of writing at least). So I recommend you use that.
dotnet add package OpenTelemetry.Exporter.Prometheus.AspNetCore --version 1.9.0-beta.2
Then you can add a more complete set of Meters to your application like so:
    services.AddOpenTelemetry()
        .WithMetrics(builder =>
        {
            builder.AddPrometheusExporter();
            builder.AddAspNetCoreInstrumentation();
            builder.AddRuntimeInstrumentation();
            builder.AddHttpClientInstrumentation();
        });
If you F12 into these you can see that these add the packages as before:
For instance AddAspNetCoreInstrumentation add all the built in metrics for ASP.NET Core.
return builder
             .AddMeter("Microsoft.AspNetCore.Hosting")
             .AddMeter("Microsoft.AspNetCore.Server.Kestrel")
             .AddMeter("Microsoft.AspNetCore.Http.Connections")
             .AddMeter("Microsoft.AspNetCore.Routing")
             .AddMeter("Microsoft.AspNetCore.Diagnostics")
             .AddMeter("Microsoft.AspNetCore.RateLimiting");
etc.
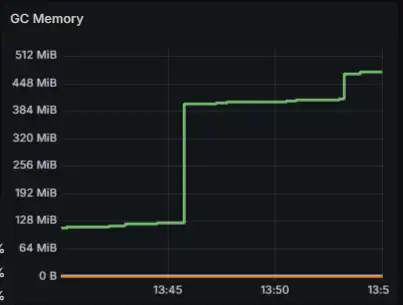
Once these are enabled you can get more information in your dashboards. For example I added a GC meter in mine to show memory usage (and quickly track down memorly leaks).
Now we have Grafana up and running I added some Caddy configuration to my Caddyfile to expose the Grafana service to the outside world.
grafana.mostlylucid.net
{
   reverse_proxy grafana:3000
}

http://grafana.mostlyucid.net
{
   redir https://{host}{uri}
}
I pointed my Domain to this Caddy server and now I can access Grafana from the outside world.
Once you have everything running, you can access Grafana by navigating to your url (http://localhost;3000 if running locally) in your web browser. Log in using the credentials you set in your Docker Compose file.
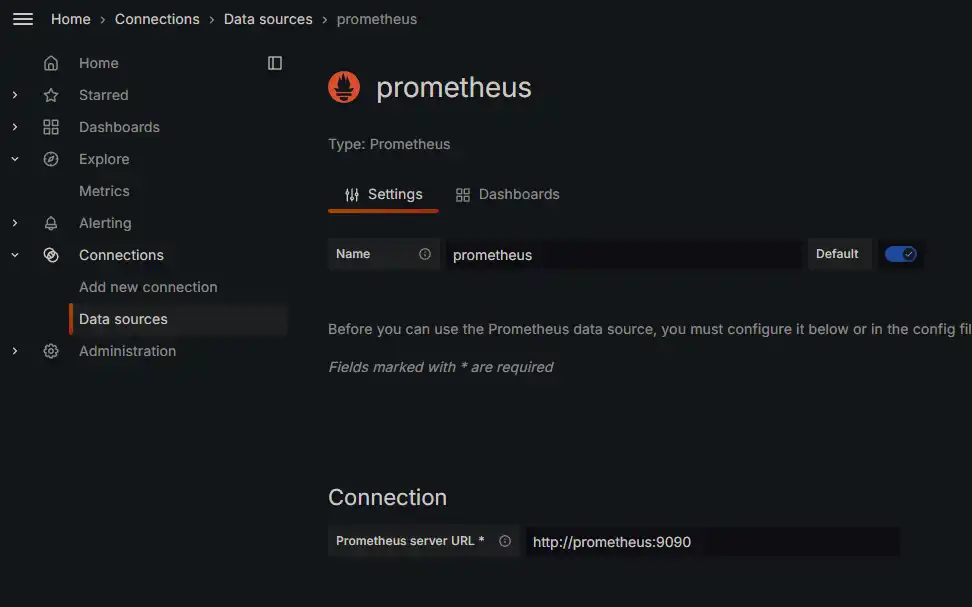
You then need to set up a data source for Prometheus. To do this, click on the gear icon in the left sidebar, then click on "Data Sources". Click on "Add data source", select "Prometheus", and configure the URL to point to your Prometheus instance (http://prometheus:9090 if running locally).
After that, you can start creating dashboards and visualizing your metrics!
We'll be using the dashboards to visualize the metrics collected from our ASP.NET Core application. You can create your own dashboards or import existing ones from the Grafana dashboard repository.
For this we'll use the following dashboards
ASP.NET Core Overview Dashboard - shows the most important metrics for ASP.NET Core applications.
ASP.NET Core Endpoint Dashboard - shows metrics for individual endpoints in your application.
To add these got to Dashboards->New->Import and paste the dashboard ID in the import field.
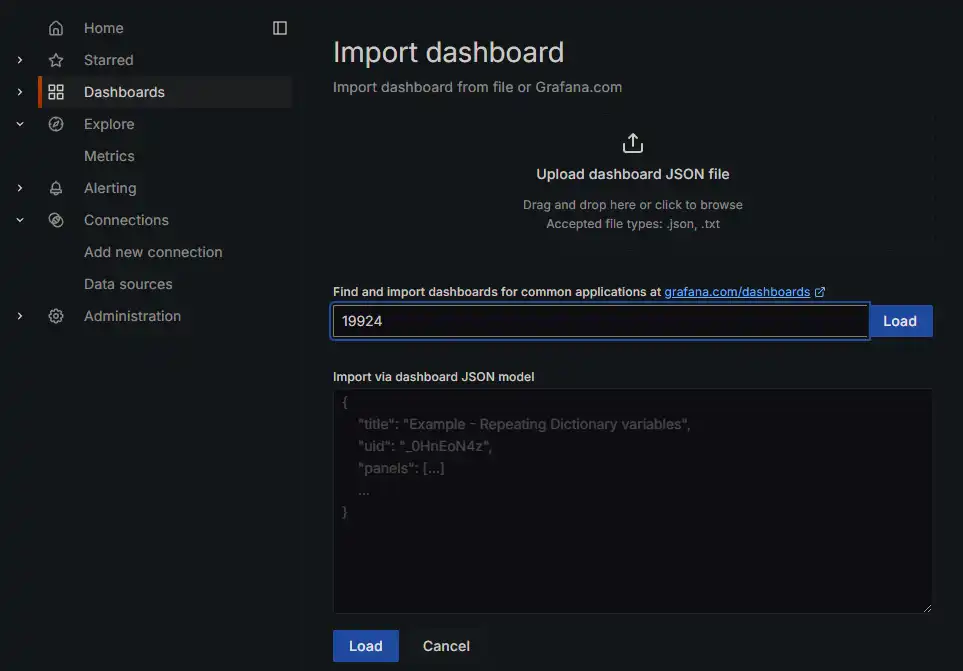
This will then add the dashboard to your Grafana instance.
THEN we can go into those newly imported dashboards and configure them to point to our Prometheus data source.
This should give you the view we saw at the beginning of the article. For Job you select the name of the Job we specifically set in the prometheus.yml file. In our case mostlylucid. Then you should start seeing metrics populate in your dashboard!
In this guide, we covered how to set up monitoring for your ASP.NET Core applications using Grafana and Prometheus. We went through the steps of configuring Docker, Prometheus, and Grafana, as well as how to expose metrics from your ASP.NET Core application. With this setup, you can now monitor the performance of your applications and gain valuable insights into their behavior. Happy monitoring!
