This is a viewer only at the moment see the article on how this works.
To update the preview hit Ctrl-Alt-R (or ⌘-Alt-R on Mac) or Enter to refresh. The Save icon lets you save the markdown file to disk
This is a preview from the server running through my markdig pipeline
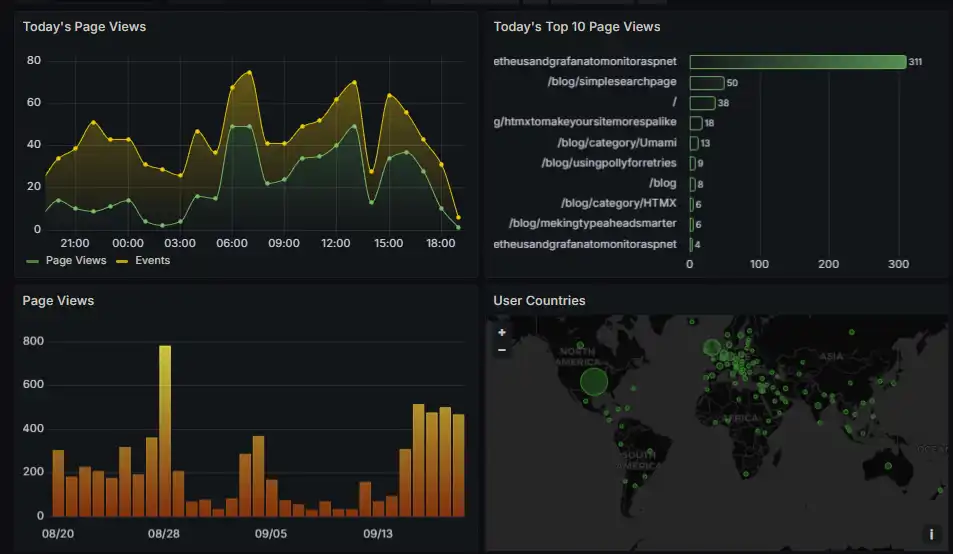
In a previous post I detailed how I added Grafana to my docker-compose to provide insights into performance for this site. As I have Umami on here AND self host the database for that in this post I'l cover how I added new panels to view the data in Grafana.
The end result is that I now have information about page views in my Grafana dashboard.
Firstly I needed to add a new data source to Grafana. This is done in the settings menu. I added a new Postgres data source and filled in the details for the database I'm using for Umami.
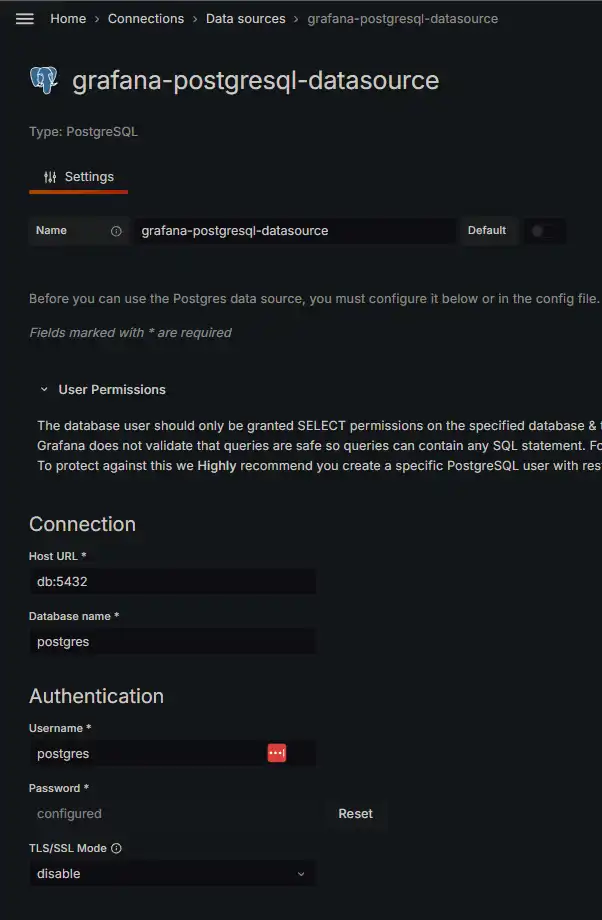
You'll see it's pretty simple, I just use the same credentials I use for the Umami database.
Next I added a new panel to the dashboard. I used the Postgres data source and wrote a query to get the data I wanted.
SELECT
  $__timeGroupAlias(created_at, '1d') ,
  COUNT(url_path) AS total_requests
FROM
  website_event
WHERE
  $__timeFilter(created_at)
  AND event_type=1
GROUP BY
  $__timeGroup(created_at, '1d')
ORDER BY
1 LIMIT 31
You'll se that I use a special 'alias' in Grafana to group my data by day __timeGroupAlias(created_at, '1d') does this for me. I also use __timeFilter(created_at) to filter the data by the time range I'm looking at.
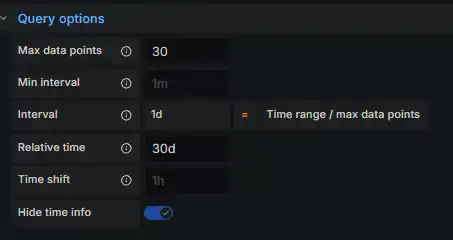
To make this have a different period than the rest of my dashboard I also specify query options specify that I want data for the last 31 days.
When I run the query (and with some tweaking in the Panel Options) I get this result.
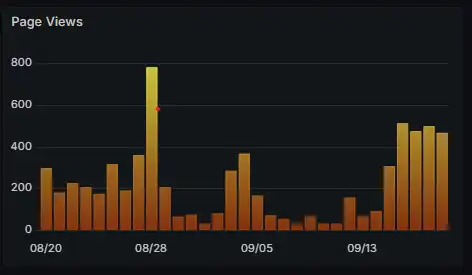
I then save this and apply it to my dashboard. Then I can see the page views for the last 31 days.
The others follow the same pattern, first just take a look in the Postgres admin tool to find the data. You can then apply this to any data source in Grafana.
So there you have it, a quick guide to adding Postgres data to Grafana. I hope this helps you get started with your own data sources.
