NOTE: Apart from
 (and even then it's questionable, I'm Scottish). These are machine translated in languages I don't read. If they're terrible please contact me.
You can see how this translation was done in this article.


Saturday, 31 August 2024
//7 minute read
In the previous part I showed you how to set up self hosting for Seq using ASP.NET Core . Now that we have it set up it's time to use more of it's features to allow for more complete logging & tracing using our new Seq instance.
Tracing is like logging++ it gives you an extra layer of information about what's happening in your application. It's especially useful when you have a distributed system and you need to trace a request through multiple services. In this site I'm using it to track down issues quickly; just because this is a hobby site doesn't mean I give up my professional standards.
Setting up tracing with Serilog is really pretty simple using the Serilog Tracing package. First you need to install the packages:
Here we also add the Console sink and the Seq sink
dotnet add package SerilogTracing
dotnet add package SerilogTracing.Expressions
dotnet add package Serilog.Sinks.Console
dotnet add package Serilog.Sinks.Seq
Console is always useful for debugging and Seq is what we're here for. Seq also features a bunch of 'enrichers' which can add extra information to your logs.
  "Serilog": {
    "Enrich": ["FromLogContext", "WithThreadId", "WithThreadName", "WithProcessId", "WithProcessName", "FromLogContext"],
    "MinimumLevel": "Warning",
    "WriteTo": [
        {
          "Name": "Seq",
          "Args":
          {
            "serverUrl": "http://seq:5341",
            "apiKey": ""
          }
        },
      {
        "Name": "Console"
      },
      {
        "Name": "File",
        "Args": {
          "path": "logs/applog-.txt",
          "rollingInterval": "Day"
        }
      }

    ],
    "Properties": {
      "ApplicationName": "mostlylucid"
    }
  }
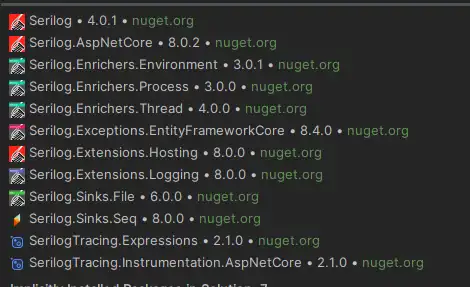
To use these enrichers you need to add them to your Serilog configuration in your appsettings.json file. You also need to install all the seperate enrichers using Nuget.
It's one of the good and bad things about Serilog, you wind up installing a BUNCH of packages; but it does mean you only add what you need and not just one monolithic package. Here's mine
With all of these bombined I get a pretty good log output in Seq.
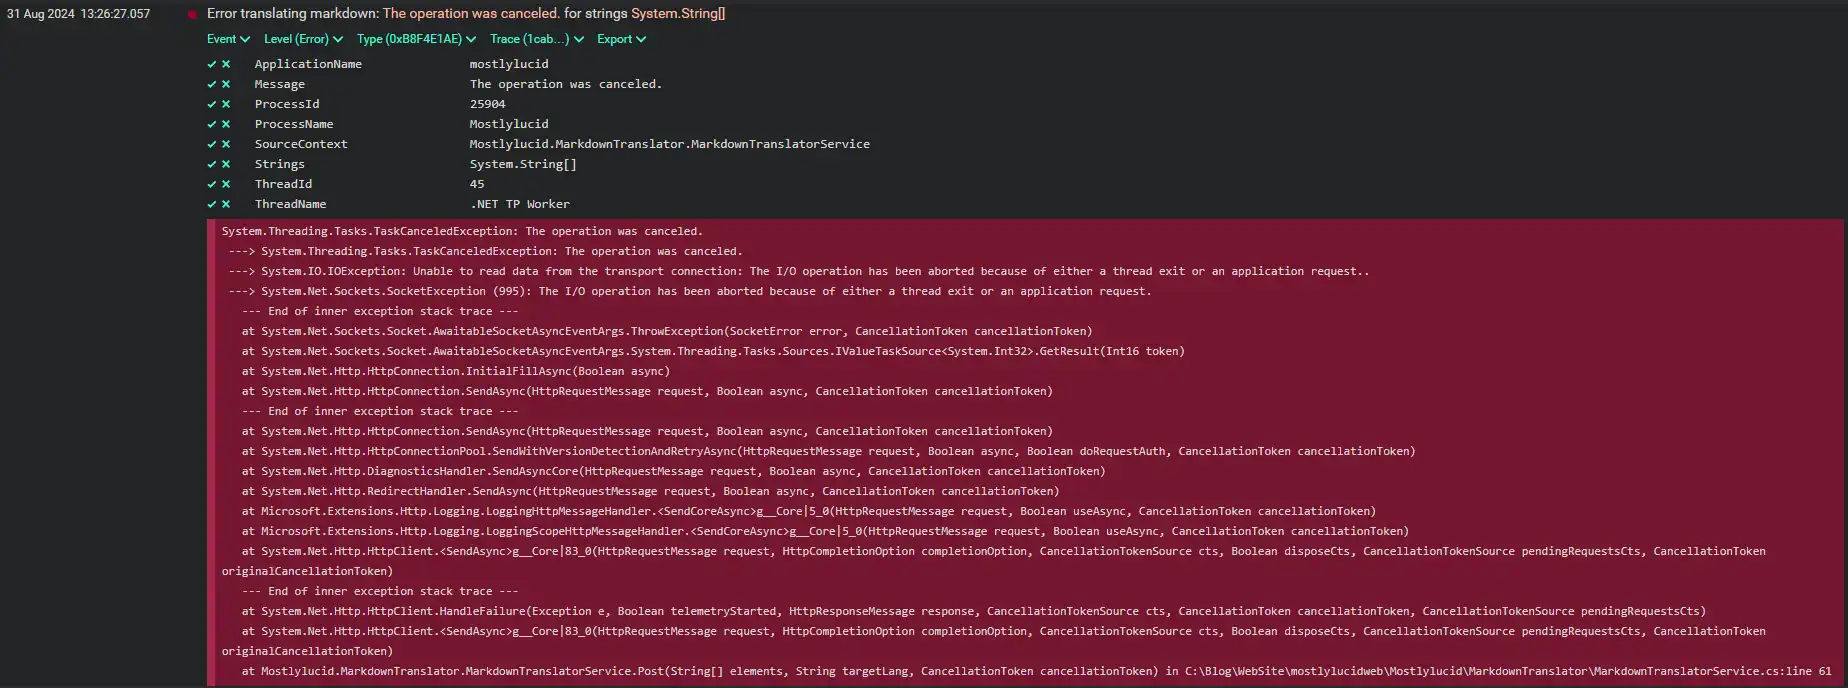
Here you see the error message, the stack trace, the thread id, the process id and the process name. This is all useful information when you're trying to track down an issue.
One thing to note is I've set the "MinimumLevel": "Warning", in my appsettings.json file. This means that only warnings and above will be logged to Seq. This is useful to keep the noise down in your logs.
However in Seq you can also specify this per Api Key; so you can have Information (or if you're really enthusiastic Debug) logging set here and limit what Seq actually captures by API key.
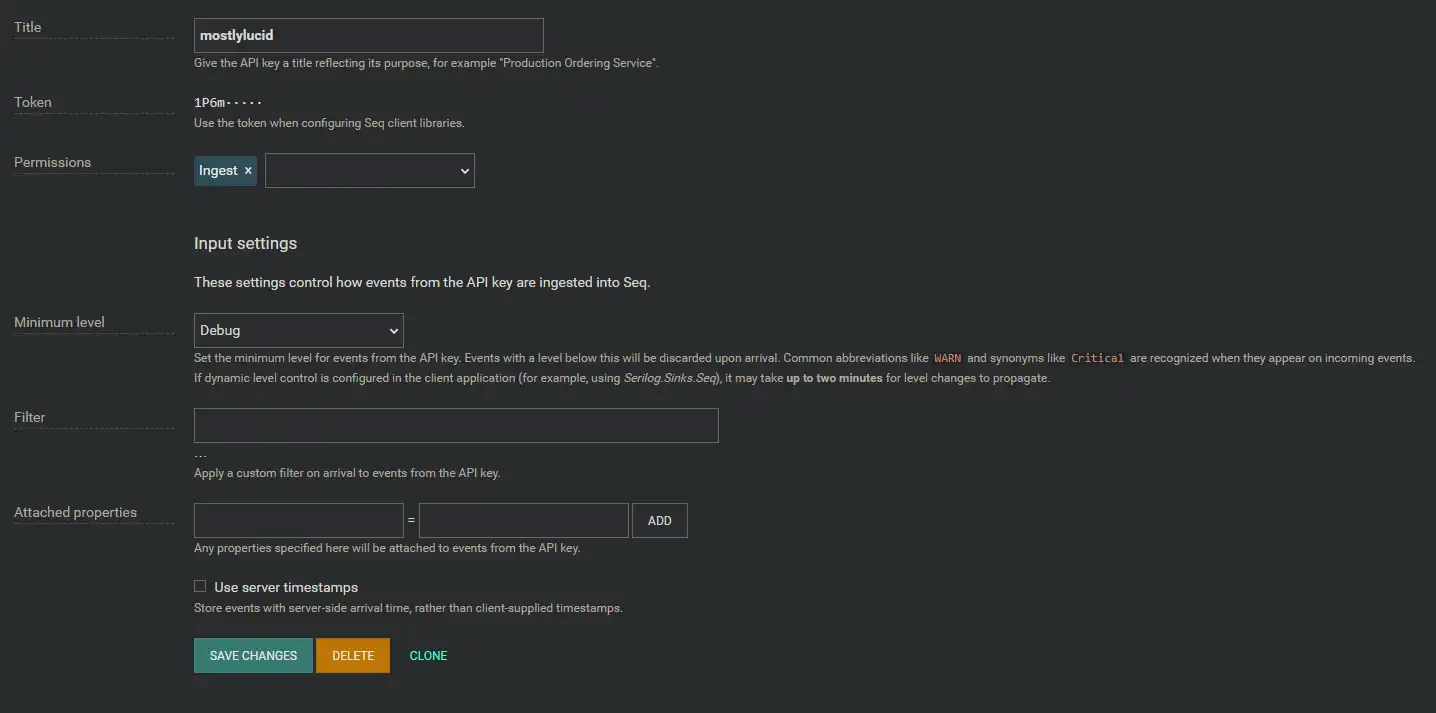
Note: you still have app overhead, you can also make this more dynamic so you can adjust the level on the fly). See the Seq sink for more details.
{
    "Serilog":
    {
        "LevelSwitches": { "$controlSwitch": "Information" },
        "MinimumLevel": { "ControlledBy": "$controlSwitch" },
        "WriteTo":
        [{
            "Name": "Seq",
            "Args":
            {
                "serverUrl": "http://localhost:5341",
                "apiKey": "yeEZyL3SMcxEKUijBjN",
                "controlLevelSwitch": "$controlSwitch"
            }
        }]
    }
}
Now we add Tracing, again using SerilogTracing it's pretty simple. We have the same setup as before but we add a new sink for tracing.
dotnet add package SerilogTracing
dontet add package SerilogTracing.Expressions
dotnet add SerilogTracing.Instrumentation.AspNetCore
We also add an extra package to log more detailed aspnet core information.
Program.csNow we can start actually using the tracing. First we need to add the tracing to our Program.cs file.
    using var listener = new ActivityListenerConfiguration()
        .Instrument.HttpClientRequests().Instrument
        .AspNetCoreRequests()
        .TraceToSharedLogger();
Tracing uses the concept of 'Activities' which represent a unit of work. You can start an activity, do some work and then stop it. This is useful for tracking a request through multiple services.
In this case we add extra tracing for HttpClient requests and AspNetCore requests. We also add a TraceToSharedLogger which will log the activity to the same logger as the rest of our application.
Now we have tracing set up we can start using it in our application. Here's an example of a service that uses tracing.
    public async Task<PostListViewModel> GetPostsByCategory(string category, int page = 1, int pageSize = 10,
        string language = MarkdownBaseService.EnglishLanguage)
    {
        using var activity = Log.Logger.StartActivity("GetPostsByCategory {Category}, {Page}, {PageSize}, {Language}",
            new { category, page, pageSize, language });
        try
        {
            var count = await NoTrackingQuery()
                .Where(x => x.Categories.Any(c => c.Name == category) && x.LanguageEntity.Name == language)
                .CountAsync();
            var posts = await PostsQuery()
                .Where(x => x.Categories.Any(c => c.Name == category) && x.LanguageEntity.Name == language)
                .OrderByDescending(x => x.PublishedDate.DateTime)
                .Skip((page - 1) * pageSize)
                .Take(pageSize)
                .ToListAsync();

            var languages = await GetLanguagesForSlugs(posts.Select(x => x.Slug).ToList());
            var postListViewModel = new PostListViewModel
            {
                Page = page,
                PageSize = pageSize,
                TotalItems = count,
                Posts = posts.Select(x => x.ToListModel(
                    languages.FirstOrDefault(entry => entry.Key == x.Slug).Value.ToArray())).ToList()
            };
            activity.Complete();
            return postListViewModel;
        }
        catch (Exception e)
        {
            activity.Complete(LogEventLevel.Error, e);
        }

        return new PostListViewModel();
    }
The important lines here are:
  using var activity = Log.Logger.StartActivity("GetPostsByCategory {Category}, {Page}, {PageSize}, {Language}",
            new { category, page, pageSize, language });
This starts a new 'activity' which is a unit of work. It's useful for tracking a request through multiple services. As we have it wrapped in a using statement this will complete and dispose at the end of our method but it's good practice to explicitly complete it.
activity.Complete();
In our exception handling catch we also complete the activity but with an error level and the exception. This is useful for tracking down issues in your application.
Now we have all this setup we can start using it. Here's an example of a trace in my application.
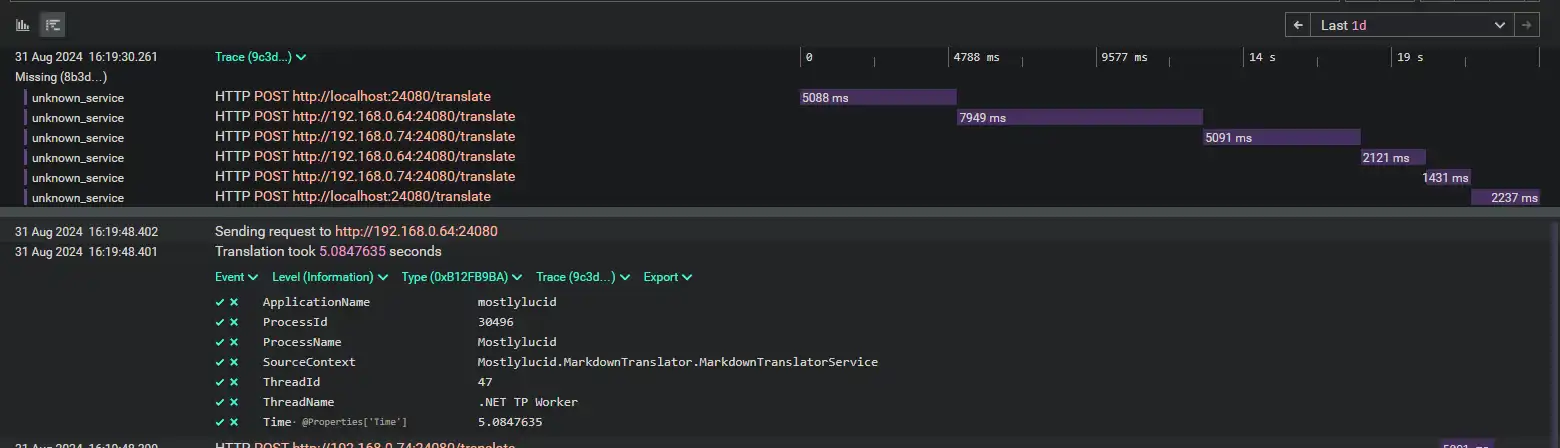
This shows you the translation of a single markdown post. You can see the multiple steps for a single post and all the HttpClient requests and timings.
Note I use Postgres for my database, unlike SQL server the npgsql driver has native support for tracing so you can get very useful data from your database queries like the SQL executed, timings etc. These are saved as 'spans' to Seq and look liek the following:
  "@t": "2024-08-31T15:23:31.0872838Z",
"@mt": "mostlylucid",
"@m": "mostlylucid",
"@i": "3c386a9a",
"@tr": "8f9be07e41f7121cbf2866c6cd886a90",
"@sp": "8d716c5f01ad07a0",
"@st": "2024-08-31T15:23:31.0706848Z",
"@ps": "622f1c86a8b33304",
"@sk": "Client",
"ActionId": "91f5105d-93fa-4e7f-9708-b1692e046a8a",
"ActionName": "Mostlylucid.Controllers.HomeController.Index (Mostlylucid)",
"ApplicationName": "mostlylucid",
"ConnectionId": "0HN69PVEQ9S7C",
"ProcessId": 30496,
"ProcessName": "Mostlylucid",
"RequestId": "0HN69PVEQ9S7C:00000015",
"RequestPath": "/",
"SourceContext": "Npgsql",
"ThreadId": 47,
"ThreadName": ".NET TP Worker",
"db.connection_id": 1565,
"db.connection_string": "Host=localhost;Database=mostlylucid;Port=5432;Username=postgres;Application Name=mostlylucid",
"db.name": "mostlylucid",
"db.statement": "SELECT t.\"Id\", t.\"ContentHash\", t.\"HtmlContent\", t.\"LanguageId\", t.\"Markdown\", t.\"PlainTextContent\", t.\"PublishedDate\", t.\"SearchVector\", t.\"Slug\", t.\"Title\", t.\"UpdatedDate\", t.\"WordCount\", t.\"Id0\", t0.\"BlogPostId\", t0.\"CategoryId\", t0.\"Id\", t0.\"Name\", t.\"Name\"\r\nFROM (\r\n    SELECT b.\"Id\", b.\"ContentHash\", b.\"HtmlContent\", b.\"LanguageId\", b.\"Markdown\", b.\"PlainTextContent\", b.\"PublishedDate\", b.\"SearchVector\", b.\"Slug\", b.\"Title\", b.\"UpdatedDate\", b.\"WordCount\", l.\"Id\" AS \"Id0\", l.\"Name\", b.\"PublishedDate\" AT TIME ZONE 'UTC' AS c\r\n    FROM mostlylucid.\"BlogPosts\" AS b\r\n    INNER JOIN mostlylucid.\"Languages\" AS l ON b.\"LanguageId\" = l.\"Id\"\r\n    WHERE l.\"Name\" = @__language_0\r\n    ORDER BY b.\"PublishedDate\" AT TIME ZONE 'UTC' DESC\r\n    LIMIT @__p_2 OFFSET @__p_1\r\n) AS t\r\nLEFT JOIN (\r\n    SELECT b0.\"BlogPostId\", b0.\"CategoryId\", c.\"Id\", c.\"Name\"\r\n    FROM mostlylucid.blogpostcategory AS b0\r\n    INNER JOIN mostlylucid.\"Categories\" AS c ON b0.\"CategoryId\" = c.\"Id\"\r\n) AS t0 ON t.\"Id\" = t0.\"BlogPostId\"\r\nORDER BY t.c DESC, t.\"Id\", t.\"Id0\", t0.\"BlogPostId\", t0.\"CategoryId\"",
"db.system": "postgresql",
"db.user": "postgres",
"net.peer.ip": "::1",
"net.peer.name": "localhost",
"net.transport": "ip_tcp",
"otel.status_code": "OK"
You can see this includes pretty much everything you need to know about the query, the SQL executed, the connection string etc. This is all useful information when you're trying to track down an issue. In a smaller app like this this is just interesting, in a distributed application it's solid gold information to track down issues.
I've only scratched the surface of Tracing here, it's a bit area with passionate advocates. Hopefully I've shown how simple it is to get going with simple tracing using Seq & Serilog for ASP.NET Core applications. In this way I can get much of the benefit of more powerful tools like Application Insights without the cost of Azure (these things can get spendy when the logs are large).
